


Why Hoppr?
Traditional TV still runs on panel estimates and slow, fragmented reporting, so big decisions rest on assumptions.
Hoppr replaces guesswork with real-time, deterministic data from live operator audiences, showing exactly who’s watching, what they watch, and when.
Operators & Telcos
Unlock new yield from every screen, unify fragmented data, and turn your platform into an intelligence and monetisation engine without capex or platform disruption
Broadcasters
Understand and grow audience value across all inventory, without sacrificing viewer experience. Get unprecedented insights into content viewability and performance
Brands & Agencies
Target real, reachable audiences based on actual behaviours, values, and interests not assumptions
1.5M+ StarHub can now see instant, real-time insights for their entire viewer base — over 1.5 million audiences — in a single unified view.
Unify every audience signal in one platform: no silos, no guesswork
Live TV behaviour
VOD viewing habits
App usage patterns
Location trends
Customer values & overlaps
& more
Operators – create advertiser-ready segments with no overlap or wastage.
Broadcasters – define smarter clusters for content, promos, and upsell.
Agencies & Brands – target high-value audiences aligned to campaign goals.
Build Your Own Custom Audience: Combine, Filter, Tailor
Hoppr lets you design precise, deduplicated audiences using real viewing behaviour. Start with 500+ pre-built segments, then combine and filter them into groups ready for activation across TV environments.
Mix signals across content, viewing intensity, platforms, households, interests, values, and location.
One audience view, ready to activate across live TV, VOD, apps, mobile, YouTube, and more.
Combat Sports Fans
Hoppr shows this group indexing higher for stimulation values and lower for openness to change. That insight can be activated across live TV, VOD, and apps, rather than a single programme.
Compare audience segments instantly: from big picture to hidden patterns
What you can compare:
Side-by-side behavioural analysis
Values and motivations at segment level
Category, genre, and platform affinities
Identification of high-value micro-audiences
Opportunities for audience extension
& more
Complete TV Intelligence in One Platform
Hoppr brings audiences, outcomes, and inventory into a single, real-time view. Across live TV, VOD, apps, and overlays, it enables smarter planning, sharper targeting, and continuous campaign optimisation.

What You Get
Personalisation Across Total TV
Deliver the right message to the right household, across SSAI, overlays, apps, and extended screens.
Live Performance Management
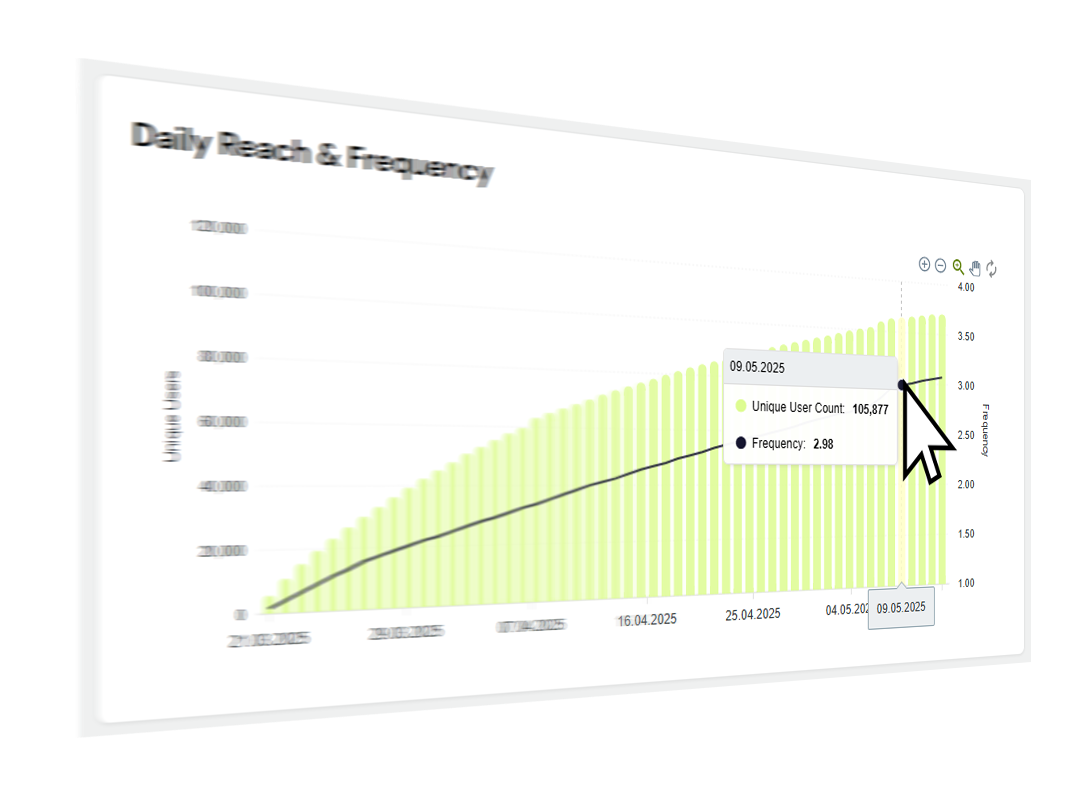
See reach, frequency, and outcomes in real time. Optimise campaigns while they’re live.


Campaign & Yield Planning
Balance audience mix, inventory value, and yield. Reduce wastage and improve returns across operators, broadcasters, and brands.
Audience & Inventory Intelligence
One view of live TV, VOD, and apps. Build privacy-safe segments or use insights for content, pricing, and retention.


Proven Results That Speak for Themselves
Measured impact across the TV ecosystem.

$2M+
Content bundle sales driven by targeted sporting bundle promotions for StarHub in Singapore

91%
Completion rates for premium airline targeting high-value traveller segments

In-store Uplift
Hoppr proved TV drove real in-store visits for Furniture Brand Designer Sale, giving the brand measurable ROI from the big screen.

No Wastage
No advertising wastage reaching time-poor professionals for major food delivery platform
The Hoppr Advantage
Finally, TV advertising that works as precisely as digital — without losing the premium brand environment your audiences expect.
Deterministic, Operator-Verified Audiences

Zero Wastage

Real-Time Intelligence

Hundreds of Ready-Built Segments

Privacy-First Design


One Platform, Multiple Teams
Ready to See It?
Book a Demo
Whether you're an operator looking to monetise platform data or a brand seeking premium TV audiences with digital precision, Hoppr transforms how you approach television advertising. See exactly how Hoppr could unlock value for your business with a personalised demonstration.